Contact Support
MatCalc Engineering is devoted to providing high quality support to our customer. MatCalc superiority results depend strongly on the input data provided to the software. We help you to use the full capabilities of the MatCalc software.
We are always available for you.
Frequently Asked
Questions
-
Getting just nice numbers as MatCalc simulation results is not everything. It is also important to make them understandable for the user. Some user inquiries on this topic are addressed in this section. You can find some more information at https://www.matcalc.at/index.php/documentation/reference-book
-
Diagnosis
When preparing the descriptions on the plot elements (title, axes, legend), the usage of special symbols not found on the keyboard would be desired (e.g. for the phase names).
When preparing the descriptions on the plot elements (title, axes, legend), the usage of the special text features (e.g. subscript) is desired (e.g. for the units).
Background
MatCalc uses HTML as a basis for the text editing in the GUI. In this regards, the editing of the plot descriptions resembles the text edition on the HTML websites.
Solution
Introduction of the special symbols or the special text features (e.g. bold text, underlined text) on the plots is possible with the usage of the HTML tags or HTML syntax. Some of the examples are given below:
Text appearing Text typed m3 m<sup>3</sup> Fe3C Fe<sub>3</sub> Bold text <b>Bold text µm <html>μm β <html>β Γ <html>Γ Feel free to find more hints on tags/syntax in the HTML references - this information can be found also in Internet.
-
Diagnosis
An additional user-defined window is needed, but no 'create user-defined' button is available.
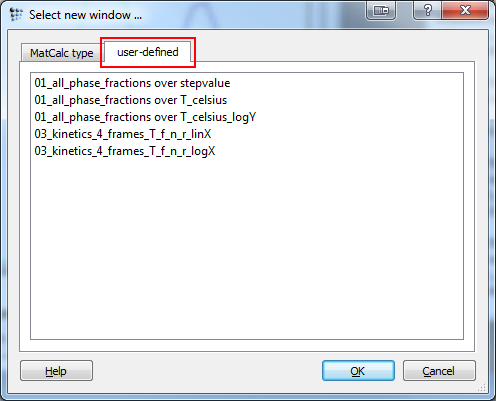
BackgroundUser defined functions are stored in the /Matcalc/scripts/frame_scripts folder at your local MatCalc installation path. On the event of opening the 'Select new window' dialog, the folder is checked and the scripts found are presented (see picture below).
Solution
Create the user defined function in the same way as you would create any other script. If you are not yet familiar with the MatCalc way of scripting, use one of the provided user-defined functions and modify them according to your needs. Assume the following: You want to plot the weight percent of alloying elements in the phase over temperature in Celsius. Now have a look at the provided '01_all_phase_fractions over T_celsius.mcs' script:
new-gui-window p1 $ create plot window
move-gui-window . 150 100 600 500 $ move and resize plot window
$ define default x-axis properties
set-gui-window-property . s u y $ use default x-axis for all plots
set-gui-window-property . s t temperature / °C $ axis title
set-gui-window-property . x T$c $ x-axis data
$ define plot properties: phase fraction
set-plot-option . a y 1 t phase fraction $ axis title
set-plot-option . s n b f$* $ add seriesIn order to plot the alloying elements of any or a certain phase, respectively, over the temperature in Celsius, you simply need to modify the last part of this script:
$ define plot properties: alloying elements
set-plot-option . a y 1 t fraction of chemical elements $ axis title
set-plot-option . s n b x$PHASE$ELEMENTBe aware that MatCalc can only handle one wildcard (*) at a time. You either have to choose a certain phase, e.g. x$fcc_a1$* to plot the chemical contents of the fcc_a1 phase, or a certain element, e.g. x$*$cr to plot the fraction of chromium in all phases. It is of course always an option to plot a specific element in phase by using no wildcard: x$fcc_a1$cr.
Save the modified script by using a representative file name and save it to the path shown above. It should now be accessible via the user-defined dialog.
-
Diagnosis
Upon drag'n'dropping a variable from the variable window to a plot, the variable is always plotted in fraction. Modifying the data via the options window is tiring, especially when dealing with many series.
Background
MatCalc uses fraction for the plotting of phases just as it uses Kelvin for temperature. By adding the modifier '$C' to the temperature, you can change it from Kelvin to Celsius. Analogously a modifier can be applied for units.
Solution
When hovering over a variable in the variables dialog, the window below offers some interesting information. The important information for our case is the 'legal unit qualifiers'-part. There is a describtion about which modifier can be applied to a variable thus changing it.
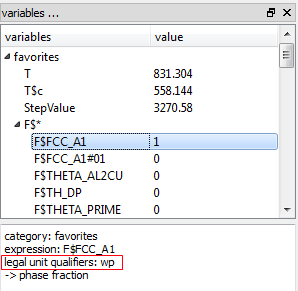
It is obvious from the figure above, that 'wp', meaning 'weight percent' is a legal modifier to the phase fraction.
How to apply this modifier?Start by opening a new X-Y-Plot if you haven't got one open already. Then, click the variable (e.g. F$* to plot all phase fraction) and drag it to the plot. DO NOT drop it yet. Press the 'Ctrl' key and release the mouse button while still holding the CTRL key. A window will now pop up:
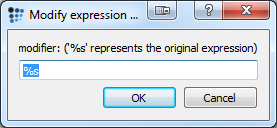
This dialog box lets you modify the selected variable. '%s' represents the variable you have dragged (which is 'F$*' in our case). By appending '$wp' to the '%s' we modify the phase fraction to the following expression: 'F$*$wp'. Thus, we plot the phase fraction for all phase in weight percent. Press 'OK' to plot the expression.
-
You might have noticed that there is a plenty of MatCalc variables. Finding the one that you are interested in, might require some attention to the details. Some user inquiries on this topic are addressed in this section. You can find some more information at https://www.matcalc.at/index.php/documentation/reference-book
-
MatCalc uses an International System of Units (known also as SI) and all variables are by default expressed in the units specified in this system. The compositions are by default expressed in mole fractions. The intensive variables refer to mole of substance by default.
In some cases, the values might be expressed also in the other units. This is done by the attachment of the 'unit qualifiers' which are suffixes attached to the variable's name, after the usual '$' (conjunction symbol). More than one unit qualifier can be applied. Some examples are shown below with the unit qualifiers underlined:
'T' → Temperature expressed in Kelvin (default unit).'T$C' → Temperature expressed in Celsius degrees.
'F$FCC_A1' → Phase fraction of FCC_A1 phase expressed in mole fraction (default unit).
'F$FCC_A1$P' → Phase fraction of FCC_A1 phase expressed in mole percent.
'X$BCC_A2$C' → Carbon content of BCC_A2 phase expressed in mole fraction (default unit).
'X$BCC_A2$C$WP' → Carbon content of BCC_A2 phase expressed in weight percent.
Below is the list of the available unit qualifiers:
Unit qualifier Meaning Comment C degree Celsius relevant for temperature K mass relates the intensive variables to one kilogram of a phase V volume relates the intensive variable to one cubic meter of a phase,
valid only with physical database read
W weight content relevant for phase fractions, phase compositions P percent multiplies the value by 100 X inverse returns the inverse value L natural logarithm returns the natural logarithm of the value G common logarithm returns the common logarithm of the value -
As the first approximation, the densities of all phases in the system can be assumed to be the same. In this case, the phase fractions expressed in volume fraction are the same as the ones in mole fraction, i.e. these can be represented by the 'F$Phase' variable value.
The actual differences can be noticed when a physical database ('.pdb'-file) is read in MatCalc – this is the third type of the databases provided with MatCalc, next to the thermodynamic ('.tdb'-files) and diffusion ('.ddb'-files) ones.
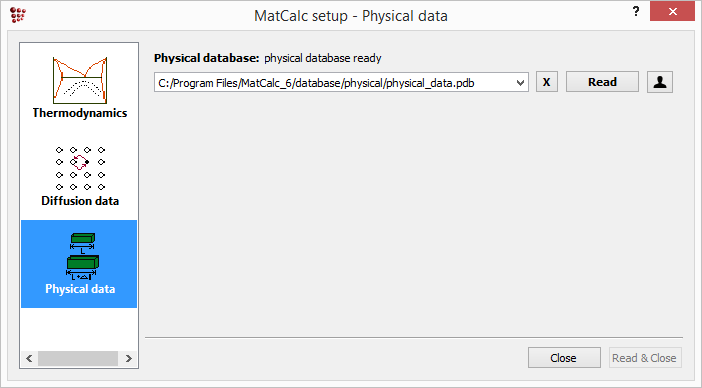
Upon reading the database, the molar volumes (a reciprocal of the molar density) are loaded for all the phases. These variables are located in the 'mass/volume/density' section.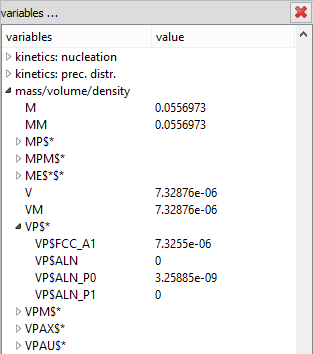
The 'VP$Phase' variables represent the volume of the phase in the system. The 'V' variable represents the volume of the whole system. Hence, the volume fraction can be calculated as the ratio of 'VP$Phase' to 'V' variable, e.g. 'VP$FCC_A1/V'.